Stress-strain Diagram
Suppose that a metal specimen be placed in tension-compression-testing machine. As the axial load is gradually increased in increments, the total elongation over the gauge length is measured at each increment of the load and this is continued until failure of the specimen takes place. Knowing the original cross-sectional area and length of the specimen, the normal stress σ and the strain ε can be obtained. The graph of these quantities with the stress σ along the y-axis and the strain ε along the x-axis is called the stress-strain diagram. The stress-strain diagram differs in form for various materials. The diagram shown below is that for a medium-carbon structural steel.
Metallic engineering materials are classified as either ductile or brittle materials. A ductile material is one having relatively large tensile strains up to the point of rupture like structural steel and aluminum, whereas brittle materials has a relatively small strain up to the point of rupture like cast iron and concrete. An arbitrary strain of 0.05 mm/mm is frequently taken as the dividing line between these two classes.
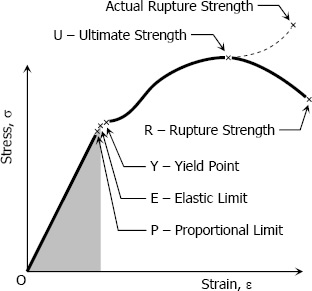
Stress-strain diagram of a medium-carbon structural steel
Proportional Limit (Hooke's Law)
 From the origin O to the point called proportional limit, the stress-strain curve is a straight line. This linear relation between elongation and the axial force causing was first noticed by Sir Robert Hooke in 1678 and is called Hooke's Law that within the proportional limit, the stress is directly proportional to strain or
The constant of proportionality k is called the Modulus of Elasticity E or Young's Modulus and is equal to the slope of the stress-strain diagram from O to P. Then
Elastic Limit
The elastic limit is the limit beyond which the material will no longer go back to its original shape when the load is removed, or it is the maximum stress that may e developed such that there is no permanent or residual deformation when the load is entirely removed.
Elastic and Plastic Ranges
The region in stress-strain diagram from O to E is called the elastic range. The region from E to R is called the plastic range.
Yield Point
Yield point is the point at which the material will have an appreciable elongation or yielding without any increase in load.
Ultimate Strength
The maximum ordinate in the stress-strain diagram is the ultimate strength or tensile strength.
Rapture Strength
Rapture strength is the strength of the material at rupture. This is also known as the breaking strength.
Modulus of Resilience
Modulus of resilience is the work done on a unit volume of material as the force is gradually increased from O to P, in N·m/m3. This may be calculated as the area under the stress-strain curve from the origin O to up to the elastic limit E (the shaded area in the figure). The resilience of the material is its ability to absorb energy without creating a permanent distortion.
Modulus of Toughness
Modulus of toughness is the work done on a unit volume of material as the force is gradually increased from O to R, in N·m/m3. This may be calculated as the area under the entire stress-strain curve (from O to R). The toughness of a material is its ability to absorb energy without causing it to break.
Working Stress, Allowable Stress, and Factor of Safety
Working stress is defined as the actual stress of a material under a given loading. The maximum safe stress that a material can carry is termed as the allowable stress. The allowable stress should be limited to values not exceeding the proportional limit. However, since proportional limit is difficult to determine accurately, the allowable tress is taken as either the yield point or ultimate strength divided by a factor of safety. The ratio of this strength (ultimate or yield strength) to allowable strength is called the factor of safety.